Bollinger + RSI, Double Strategy by ChartArt1
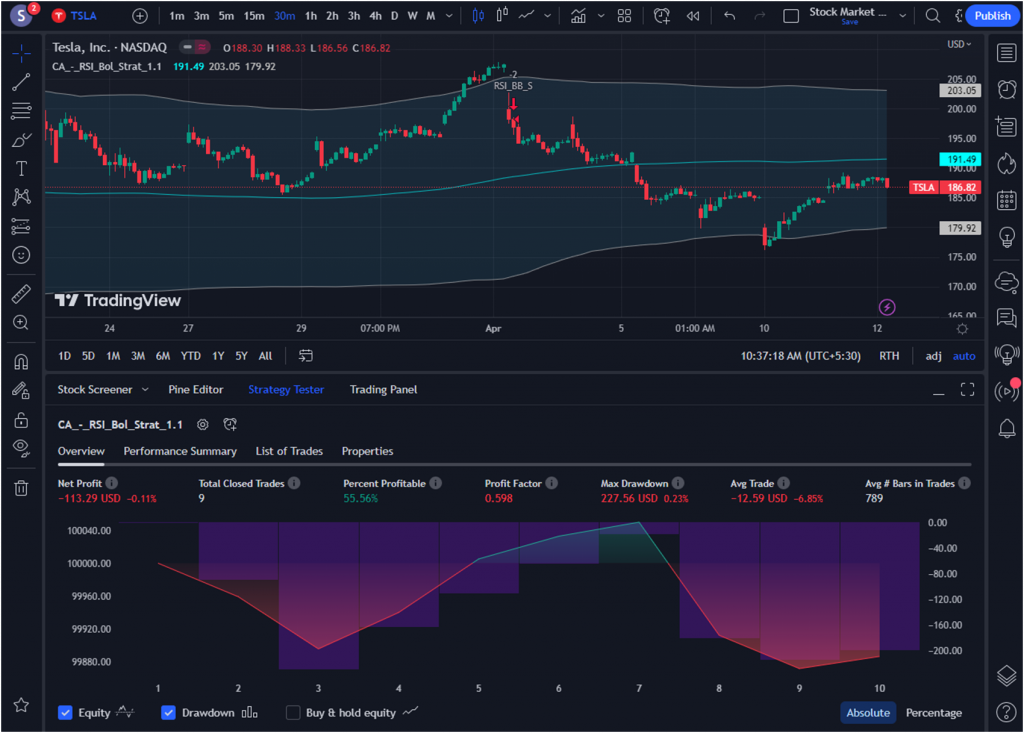
The Bollinger + RSI Double Strategy are a technical analysis trading strategy that combines two popular indicators: Bollinger Bands and Relative Strength Index (RSI). This strategy was developed by ChartArt and version 1.1 of the strategy was released on their website.
Using Bollinger Bands and RSI Together for Trading Success
Introduction:
As a trader, you’re always looking for an edge in the market. Two popular indicators that can help you gain that edge are Bollinger Bands and Relative Strength Index (RSI). While they are effective on their own, combining them can lead to even more profitable trades.

Here Is the Link of the Indicator.
In this article, we’ll dive into what Bollinger Bands and RSI are, how to use them together, and a trading strategy that utilizes both indicators for trading success.
Part 1: Bollinger Bands
Bollinger Bands are used to measure the volatility of a financial instrument and are constructed using three lines:
- The middle line, which is usually a 20-period simple moving average (SMA).
- The upper band, which is two standard deviations above the middle line.
- The lower band, which is two standard deviations below the middle line.
When prices move outside of the bands, it’s seen as a sign of increased volatility and potentially a trading opportunity.
Part 2: Relative Strength Index (RSI)
The RSI is another popular technical analysis tool that was developed by J. Welles Wilder Jr. in 1978. It measures the strength and momentum of a financial instrument and is calculated using the average gains and losses over a specified time period (usually 14 periods).
Traders often use the RSI to identify potential trend reversals or to confirm trend strength.
Part 3: Combining Bollinger Bands and RSI
By combining Bollinger Bands and RSI, traders can get a more complete picture of the market. When the price is trading within the Bollinger Bands, it suggests that the market is in a period of consolidation. However, when the RSI is in an overbought or oversold condition, it can provide an early warning of a potential trend reversal.
One way to use these indicators together is to look for buy or sell signals when the price crosses above or below the upper or lower Bollinger Band, respectively, and the RSI is in an overbought or oversold condition. This suggests that the market is in a strong trend and can help traders make profitable trades.
Part 4: Trading Strategy
To implement this strategy, traders can use a script like the one provided in this article. The script sets up the Bollinger Bands and RSI indicators with user-defined inputs for the period length and standard deviation multiplier.
The script then defines the conditions for a buy or sell signal based on the price crossing above or below the Bollinger Bands and the RSI being in an overbought or oversold condition. When a signal is triggered, the script places a stop order at the appropriate Bollinger Band level and cancels any existing orders in the opposite direction.
Traders can use this script to backtest the strategy on historical data and make adjustments as needed to optimize their results.
Bollinger Bands and RSI are two powerful technical analysis tools that can help traders gain an edge in the market. By combining them, traders can get a more complete picture of the market and make profitable trades based on strong trends.
Remember, no trading strategy is foolproof, and it’s important to always manage risk and use proper money management techniques. However, by using Bollinger Bands
This script is a strategy that combines the Relative Strength Index (RSI) and Bollinger Bands indicators to generate buy and sell signals for trading. The script is written in TradingView’s Pine Script programming language.
Here is a brief explanation of the settings used in the script:
- RSIlength – The period length used for the RSI indicator.

- RSIoverSold – The oversold level used for the RSI indicator. The default value is 50.
- RSIoverBought – The overbought level used for the RSI indicator. The default value is 50.
- BBlength – The period length used for the Bollinger Bands indicator.

- BBmult – The standard deviation multiplier used for the Bollinger Bands indicator. The default value is 2.
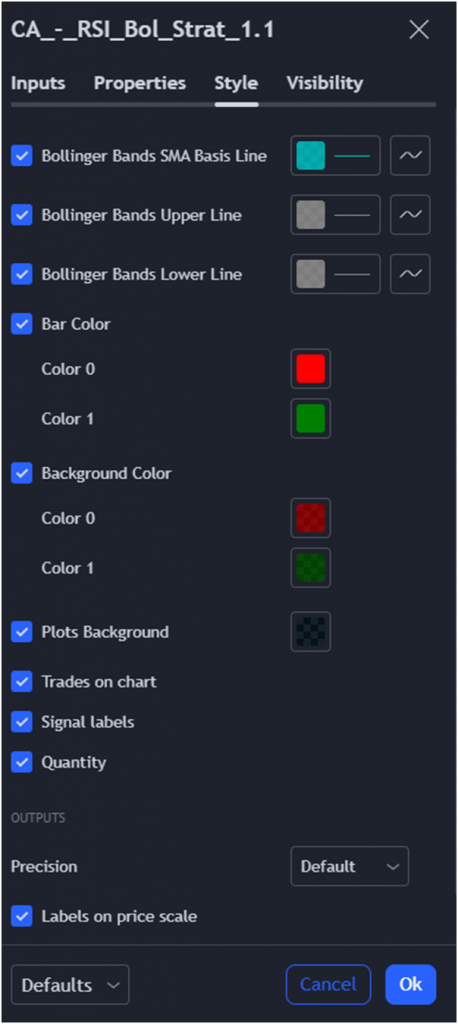
- switch1 – A boolean input used to enable/disable the coloring of bars based on the trading signals.

- switch2 – A boolean input used to enable/disable the coloring of the background based on the trading signals.
The script uses these indicators to generate buy and sell signals based on the following rules:
- Buy signal: When the RSI indicator crosses above the oversold level AND the price crosses above the lower Bollinger Band.
- Sell signal: When the RSI indicator crosses below the overbought level AND the price crosses below the upper Bollinger Band.
The script also includes code to plot the Bollinger Bands on the chart, as well as to color the bars and background based on the trading signals. Finally, the script includes code to manage the trading orders and plot the equity curve of the strategy.
To add an alert to this indicator, you can use the alertcondition() function provided by Pine Script. This function allows you to define a specific condition that will trigger an alert when met.

Here’s an example of how to add an alert to this indicator when a buy or sell signal is generated:
// Alert conditions for buy and sell signals
alertcondition(crossover(vrsi, RSIoverSold) and crossover(source, BBlower),
title=”Buy Signal”, message=”RSI and price cross below lower Bollinger Band”)
alertcondition(crossunder(vrsi, RSIoverBought) and crossunder(source, BBupper),
title=”Sell Signal”, message=”RSI and price cross above upper Bollinger Band”)
In this code snippet, alertcondition() is used to define two conditions: one for the buy signal and one for the sell signal. The first parameter is the condition that triggers the alert, and the second parameter is the message that will be displayed when the alert is triggered.
The first alert condition will trigger when the RSI crosses above the oversold level AND the price crosses above the lower Bollinger Band. The alert message will display “Buy Signal” and the message “RSI and price cross below lower Bollinger Band”.
The second alert condition will trigger when the RSI crosses below the overbought level and the price crosses below the upper Bollinger Band. The alert message will display “Sell Signal” and the message “RSI and price cross above upper Bollinger Band”.
Once you have added these alert conditions to the script, you can configure the alerts by clicking the “Add Alert” button on the TradingView chart and selecting the appropriate condition. This will allow you to receive notifications via email, SMS, or TradingView app when the buy or sell signals are generated.
In summary, adding alerts to this indicator can help you stay informed of potential trading opportunities, even if you’re not actively watching the charts.