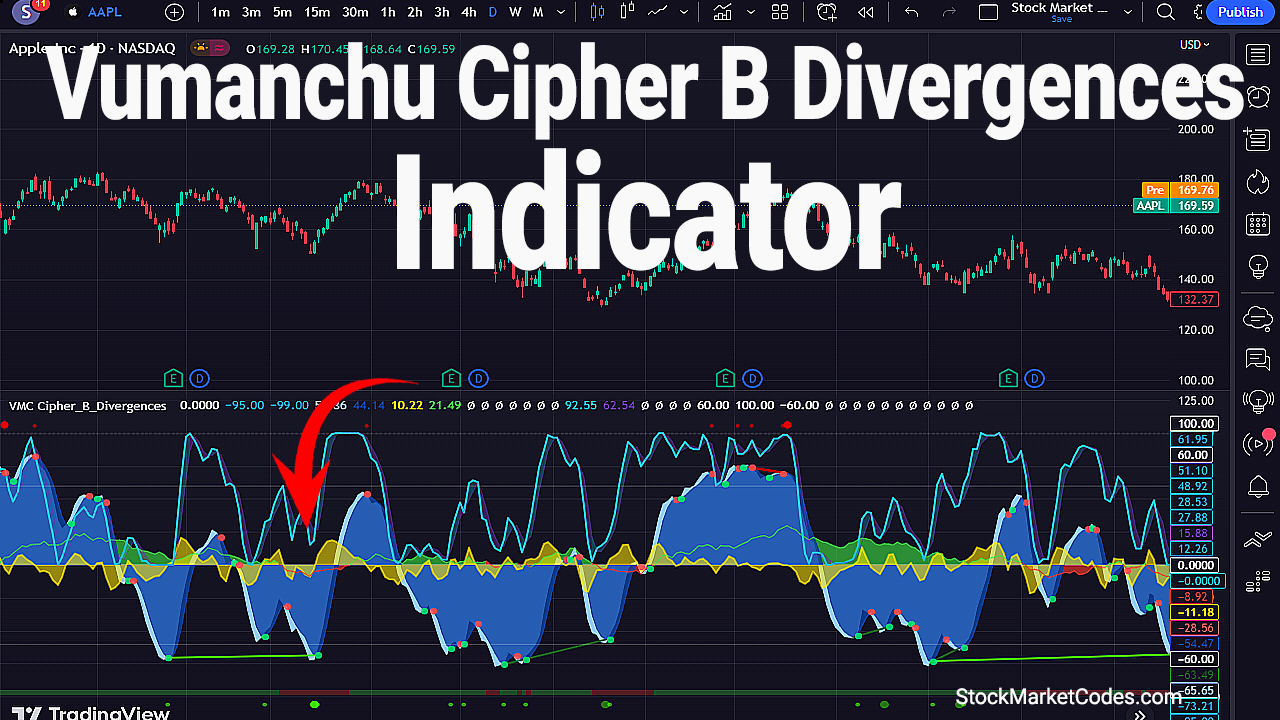
Vumanchu Cipher B Divergences Indicator
The VumanChu B Divergences is an indicator used in trading to identify divergences and market reversals. This indicator is a combination of multiple sub-indicators, including WaveTrend, RSI, and Stochastic, among others. It is a comprehensive tool that provides traders with a better understanding of the market by analyzing multiple indicators.
The VumanChu B Divergences indicator has several parameters that can be adjusted to suit individual preferences. One can decide which sub-indicator to display, including the WaveTrend, RSI, and Stochastic. Each of these sub-indicators has its parameters that can be fine-tuned.
The WaveTrend sub-indicator is used to show the trend direction and its strength. It comes with three overbought and three oversold levels that can be adjusted. The WaveTrend also includes regular and hidden divergences, with OB/OS limits that can be turned on or off.
The RSI sub-indicator is used to measure the strength of a security by comparing its average gains and losses over a specific period. The RSI also has overbought and oversold levels that can be adjusted to suit individual preferences. The VumanChu B Divergences includes regular and hidden divergences for RSI, with bearish and bullish divergence minimums that can be adjusted.
The Stochastic sub-indicator is used to show the location of the current price relative to its high-low range over a specified period. It is a momentum indicator that shows the current price’s speed and change of movement. The VumanChu B Divergences includes regular and hidden divergences for the Stochastic, with a smooth parameter that can be adjusted.
The indicator has several customizable settings or parameters, which can be adjusted according to the user’s preferences. These parameters include:
WaveTrend: This is a trend-following oscillator that is calculated based on price action and trend indicators. It has several settings that can be customized, including whether to show the WaveTrend line, Buy dots, Gold dots, Sell dots, and divergence dots. The user can also adjust the length and source of the moving average used in the calculation of the WaveTrend, as well as the overbought and oversold levels.
Divergence WT: This setting allows the user to specify whether or not to show regular and hidden divergences on the WaveTrend. The user can also adjust the minimum levels for bearish and bullish divergences, as well as a second set of divergence levels.
RSI+MFI: This setting allows the user to show the Money Flow Index (MFI) and adjust its period, multiplier, and position on the chart. The user can also choose to show the Relative Strength Index (RSI) and adjust its length, oversold and overbought levels, and divergence levels.
RSI Stochastic: This setting allows the user to show the Stochastic RSI indicator, which is a combination of the RSI and Stochastic oscillators. The user can choose whether to use a logarithmic scale and whether to use an average of both the K and D lines. The user can also adjust the length of the Stochastic RSI, the length of the RSI used in the calculation, and the smoothing periods for the K and D lines.
Divergence stoch: This setting allows the user to show regular and hidden divergences on the Stochastic RSI indicator. The user can adjust the minimum levels for bearish and bullish divergences.
VMC Cipher_B_Divergences indicator allow for a great deal of customization and flexibility in how the indicator is displayed on the chart. Users can adjust the indicator to suit their preferred trading style and strategy.
The VMC Cipher_B_Divergences indicator is a versatile tool designed for traders to identify potential buying or selling opportunities in the market. In this article, we will discuss the entry and exit conditions of the VMC Cipher_B_Divergences indicator.
First, let us take a look at the parameters of the indicator:
WaveTrend: This parameter shows the WaveTrend indicator on the chart.
wtBuyShow, wtGoldShow, wtSellShow: These parameters indicate the buy, gold, and sell dots on the chart.
wtDivShow: This parameter indicates the divergence dots on the chart.
vwapShow: This parameter shows the fast WT.
wtChannelLen: This parameter indicates the channel length of WT.
wtAverageLen: This parameter indicates the average length of WT.
wtMASource: This parameter sets the WT MA source.
wtMALen: This parameter sets the WT MA length.
Now, let’s discuss the entry and exit conditions of the VMC Cipher_B_Divergences indicator.
Entry Conditions:
Buy Entry: When the WaveTrend indicator crosses the oversold level from below, it is a signal for a potential buy entry. Additionally, the presence of bullish divergence dots and the MFI Area multiplier above the threshold line can confirm the buy entry.
Sell Entry: When the WaveTrend indicator crosses the overbought level from above, it is a signal for a potential sell entry. Additionally, the presence of bearish divergence dots and the MFI Area multiplier below the threshold line can confirm the sell entry.
Exit Conditions:
Buy Exit: When the WaveTrend indicator crosses the overbought level from above, it is a signal for a potential buy exit. Additionally, the presence of bearish divergence dots and the MFI Area multiplier below the threshold line can confirm the buy exit.
Sell Exit: When the WaveTrend indicator crosses the oversold level from below, it is a signal for a potential sell exit. Additionally, the presence of bullish divergence dots and the MFI Area multiplier above the threshold line can confirm the sell exit.
In conclusion, the VMC Cipher_B_Divergences indicator can be an effective tool for traders to identify potential buying and selling opportunities in the market. By following the entry and exit conditions mentioned above, traders can make informed decisions and improve their trading performance. However, it is important to remember that no indicator can guarantee success, and traders should always practice proper risk management techniques when trading.
Overall, the VumanChu B Divergences indicator is an essential tool for traders who use multiple indicators to analyze the market. It is a versatile indicator that can be customized to suit individual preferences and can provide traders with valuable insights into the market’s direction and potential reversals.
