ADX and DI Indicator By BeikabuOyaji
If you’re someone who’s interested in trading or investing, you might have heard of the ADX and DI indicator. ADX stands for Average Directional Movement Index, while DI stands for Directional Indicator. In this article, we’ll take a closer look at what the ADX and DI indicator is, how it works, and how you can use it to make more informed trading decisions.
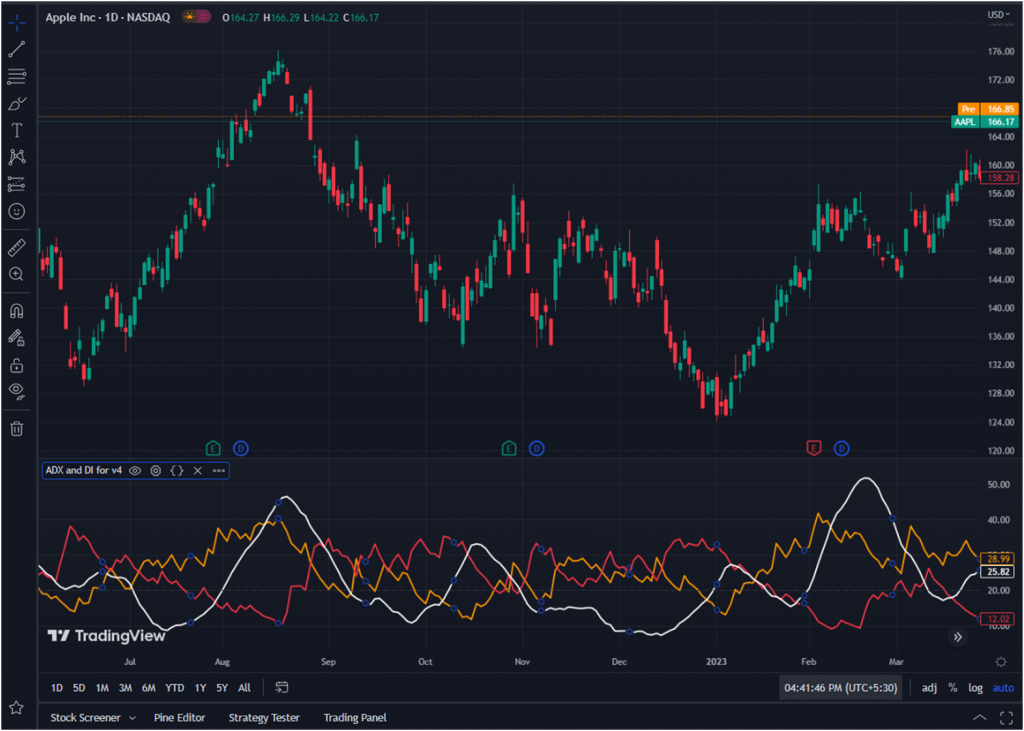
The ADX and DI indicator is a popular technical analysis tool used to measure the strength of a trend. The indicator consists of three lines: the ADX line, the DI+ line, and the DI- line. The ADX line measures the strength of the trend, while the DI+ and DI- lines measure the direction of the trend.
The ADX is calculated by taking the moving average of the difference between the positive directional movement indicator (+DMI) and the negative directional movement indicator (-DMI). The +DMI and -DMI are themselves calculated using the True Range (TR) of an asset, which takes into account the current high and low prices as well as the previous day’s closing price.
The ADX is typically used in conjunction with the +DMI and -DMI to determine the direction and strength of a trend. A high ADX reading, for example above 25, indicates a strong trend, while a low reading, below 20, suggests a weak trend or a range-bound market.

The Average Directional Index (ADX) is a technical indicator used in financial markets to measure the strength of a trend, whether it be bullish or bearish. It was developed by J. Welles Wilder in the 1970s and has since become a popular tool among traders and analysts.
The ADX line is calculated by taking the absolute difference between the DI+ and DI- lines and dividing it by the sum of the two lines. The result is then multiplied by 100 to get a percentage value. The ADX line ranges from 0 to 100, with a higher value indicating a stronger trend.
The DI+ and DI- lines are calculated by comparing the current high and low prices to the previous high and low prices. If the current high is higher than the previous high and the current low is higher than the previous low, then the DI+ line is calculated. If the current low is lower than the previous low and the current high is lower than the previous high, then the DI- line is calculated.
To calculate the ADX and DI indicator, you’ll need to input two parameters: the length of the indicator and a threshold value. The length parameter determines how many periods are used to calculate the indicator, while the threshold value determines the level at which the trend is considered strong enough to trade.
Once you’ve inputted the necessary parameters, the indicator will generate three lines on your chart: the ADX line, the DI+ line, and the DI- line. You can use these lines to make more informed trading decisions. For example, if the ADX line is above the threshold value and the DI+ line is above the DI- line, then the trend is considered bullish and you might consider buying. On the other hand, if the ADX line is above the threshold value and the DI- line is above the DI+ line, then the trend is considered bearish and you might consider selling.
In conclusion, the ADX and DI indicator is a useful tool for traders and investors looking to measure the strength and direction of a trend. By using this indicator, you can make more informed trading decisions and potentially increase your profits. However, like any technical analysis tool, it’s important to use the ADX and DI indicator in conjunction with other indicators and analysis techniques to get a more complete picture of the market.
The provided PineScript code is an implementation of the Average Directional Index (ADX) and Directional Indicator (DI) technical indicators.
ADX is a technical analysis indicator that helps determine the strength of a trend in the market. It is calculated by taking the smoothed moving average of the difference between the positive directional movement (+DM) and the negative directional movement (-DM) over a given period of time. A high ADX value indicates a strong trend, while a low ADX value indicates a weak trend.
The DI+ and DI- indicators are used to determine the direction of the trend. DI+ represents the bullish trend, while DI- represents the bearish trend. They are calculated by taking the smoothed moving average of the positive and negative directional movements, respectively, over a given period of time.
The PineScript code starts by defining the inputs for the length of the period and the threshold value. The True Range is then calculated as the maximum of three values: the difference between the high and low prices, the absolute difference between the high and the previous close price, and the absolute difference between the low and the previous close price.
The directional movement plus (+DM) and minus (-DM) are calculated based on the previous high and low prices, as well as the current high and low prices. The directional movement plus is the maximum of the difference between the current high and the previous high, or zero, while the directional movement minus is the maximum of the difference between the previous low and the current low, or zero.
The smoothed true range, directional movement plus, and directional movement minus are calculated using the previous values of each variable and the length input. The DI+ and DI- values are then calculated by dividing the smoothed directional movement plus and minus by the smoothed true range, respectively, and multiplying by 100.
The DX value is calculated as the absolute difference between the DI+ and DI- divided by their sum, multiplied by 100. Finally, the ADX is calculated as the smoothed moving average of the DX value over the length input.
The code ends by plotting the DI+ and DI- values in green and red, respectively, and the ADX value in navy blue. A horizontal line is also plotted at the threshold value to help identify strong trends.
Learn Setting Of ADX and DI
The settings in a technical analysis indicator can be just as important as the indicator itself. They allow the user to customize the indicator to their specific needs, which can greatly affect the accuracy and usefulness of the indicator. In this article, we will explain the settings used in the provided PineScript code for the Average Directional Index (ADX) and Directional Indicator (DI) technical indicators.

The first setting in the code is the len input, which defines the period length used in the calculation of the indicators. The default value for len is 14, which means that the indicators will be calculated over a 14-bar period. This period length is commonly used in technical analysis and is considered a standard value for the ADX and DI indicators. However, the period length can be adjusted to suit the user’s specific needs. Increasing the value of len will result in a smoother indicator, which can help to filter out short-term price fluctuations. On the other hand, decreasing the value of len will make the indicator more responsive to short-term price movements.

The second setting in the code is the th input, which defines the threshold value used to identify strong trends. The default value for th is 20, which means that a trend is considered strong when the ADX value is above 20. This threshold value can be adjusted to suit the user’s specific trading style and risk tolerance. A lower threshold value will result in more frequent signals, while a higher threshold value will result in fewer signals but with higher confidence. It is important to note that the threshold value should not be used in isolation, but rather in combination with other technical indicators and analysis.
In conclusion, the settings used in the PineScript code for the ADX and DI indicators are important to consider when using these indicators for technical analysis. The period length and threshold value can greatly affect the accuracy and usefulness of the indicators, and should be adjusted to suit the user’s specific needs and trading style. It is recommended to test different settings and combinations of indicators to find the most effective strategy for each individual trader.
Here I Have Turned This Indicator Into Strategy:
ADX and DI indicator converted into a strategy.
//@version=4
strategy(“ADX and DI Strategy”, overlay=true)
// Input settings
len = input(14, title=”ADX Length”)
th = input(20, title=”ADX Threshold”)
// Indicator calculations
TrueRange = max(max(high-low, abs(high-nz(close[1]))), abs(low-nz(close[1])))
DirectionalMovementPlus = high-nz(high[1]) > nz(low[1])-low ? max(high-nz(high[1]), 0): 0
DirectionalMovementMinus = nz(low[1])-low > high-nz(high[1]) ? max(nz(low[1])-low, 0): 0
SmoothedTrueRange = 0.0
SmoothedTrueRange := nz(SmoothedTrueRange[1]) – (nz(SmoothedTrueRange[1])/len) + TrueRange
SmoothedDirectionalMovementPlus = 0.0
SmoothedDirectionalMovementPlus := nz(SmoothedDirectionalMovementPlus[1]) – (nz(SmoothedDirectionalMovementPlus[1])/len) + DirectionalMovementPlus
SmoothedDirectionalMovementMinus = 0.0
SmoothedDirectionalMovementMinus := nz(SmoothedDirectionalMovementMinus[1]) – (nz(SmoothedDirectionalMovementMinus[1])/len) + DirectionalMovementMinus
DIPlus = SmoothedDirectionalMovementPlus / SmoothedTrueRange * 100
DIMinus = SmoothedDirectionalMovementMinus / SmoothedTrueRange * 100
DX = abs(DIPlus-DIMinus) / (DIPlus+DIMinus)*100
ADX = sma(DX, len)
// Strategy logic
if (ADX > th and crossover(DIPlus, DIMinus))
strategy.entry(“Long”, strategy.long)
if (ADX > th and crossunder(DIPlus, DIMinus))
strategy.entry(“Short”, strategy.short)
This strategy uses the ADX and DI indicators to generate buy and sell signals. When the ADX value is greater than the defined threshold (th), and the DI+ line crosses above the DI- line, a long position is entered. Similarly, when the ADX value is greater than the defined threshold (th), and the DI+ line crosses below the DI- line, a short position is entered.
Note that this is a simple implementation of the ADX and DI indicators as a strategy, and should not be used in isolation for trading decisions. Additional analysis and risk management techniques should be applied to any trading strategy.
This strategy is based on the ADX and DI indicators, which are commonly, used technical indicators in trend following analysis. The ADX (Average Directional Index) measures the strength of a trend, while the DI+ and DI- lines indicate the bullish and bearish components of a trend.
The strategy aims to enter a long position when the bullish DI+ line crosses above the bearish DI- line and the ADX value is above a defined threshold. Similarly, a short position is entered when the bearish DI- line crosses above the bullish DI+ line and the ADX value is above the threshold.
The threshold for the ADX value and the length of the ADX period can be adjusted by the user based on their trading preferences and risk management techniques. Additionally, it is important to note that this strategy should not be used in isolation and should be combined with additional analysis and risk management techniques to make informed trading decisions.
It is also worth noting that this strategy is a simple implementation of the ADX and DI indicators, and may not be suitable for all market conditions or trading styles. Traders should always thoroughly test and backtest any strategy before using it in live trading, and should only use strategies that align with their trading objectives and risk tolerance.
