CM_Price-Action-Bars-Price Patterns That Work!
Introduction:
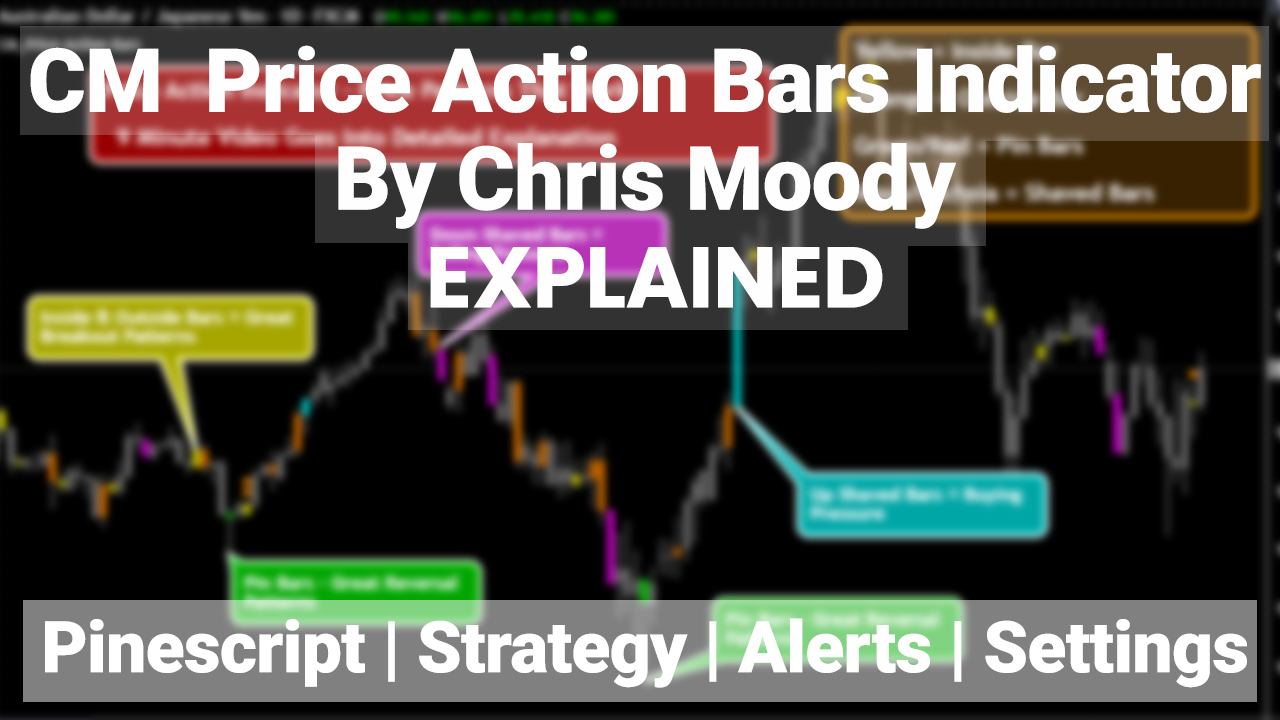
The CM_Price-Action-Bars indicator is a custom technical analysis tool designed for the TradingView platform. It is used to identify specific price action patterns on a price chart, including pin bars, shaved bars, inside bars, and outside bars. The indicator provides visual markers to help traders quickly identify these patterns and take advantage of potential trading opportunities.
This script is a custom technical indicator for the TradingView platform. It creates visual markers on the price chart for various price action patterns, including pin bars, shaved bars, inside bars, and outside bars. Users can customize the parameters for each pattern, such as the percentage of the wick required for a pin bar or the look-back period to define the trend for high and low points. The script also includes an option to turn the bars gray. The credit for this script goes to ‘Chris Capre’ from 2nd ‘Skies Forex’.
Pin Bars:
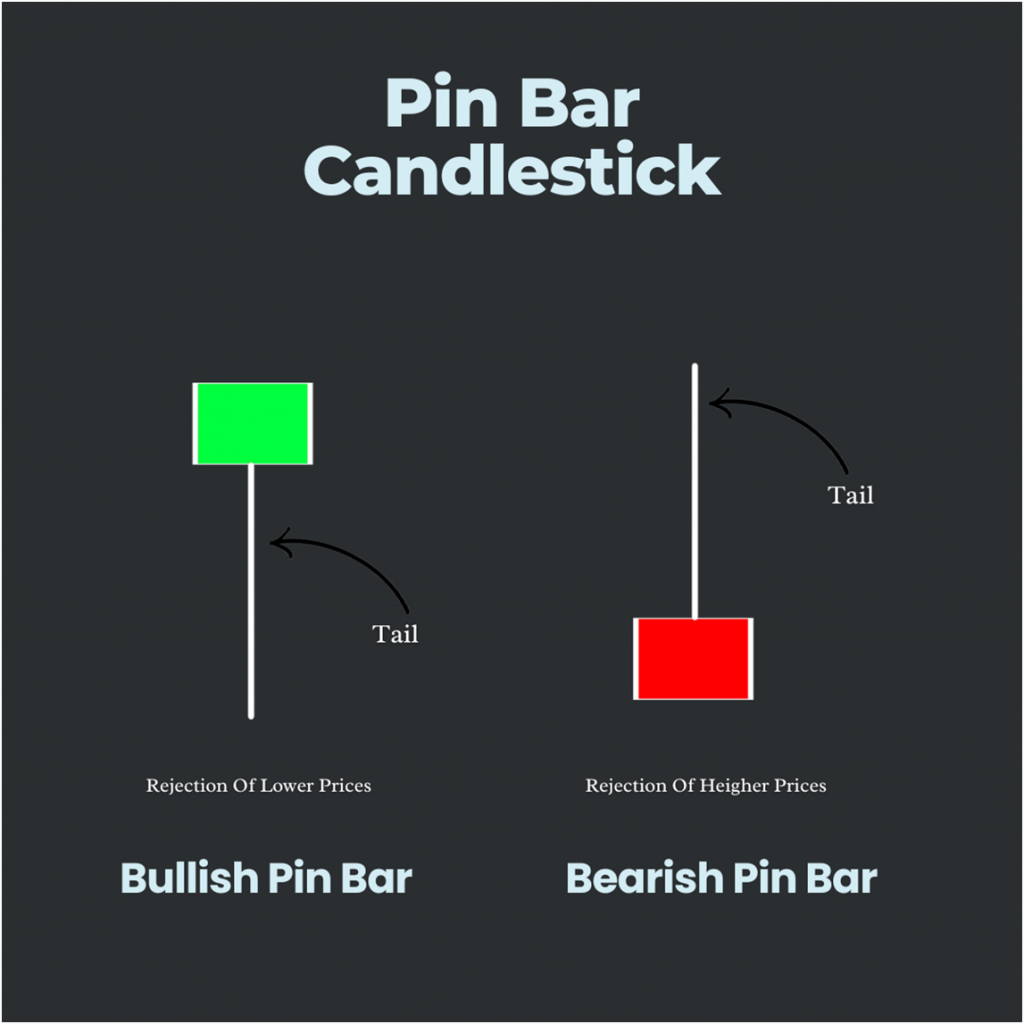
A pin bar is a candlestick pattern with a small body and a long wick on one side. It indicates a potential reversal in the current trend. The ‘CM_Price-Action-Bars indicator’ allows users to customize the percentage of the wick required for a pin bar. For example, if the user sets the percentage to 66%, the wick of the pin bar must be at least 66% of the total length of the candlestick.

To identify a bullish pin bar, the script looks for candles where the open is higher than the low and the close is near the high. For a bearish pin bar, it looks for candles where the open is lower than the high and the close is near the low. Additionally, the script takes into account the trend of highs and lows over a defined period of time (set by the user) to identify the potential reversal signal.
Shaved Bars:
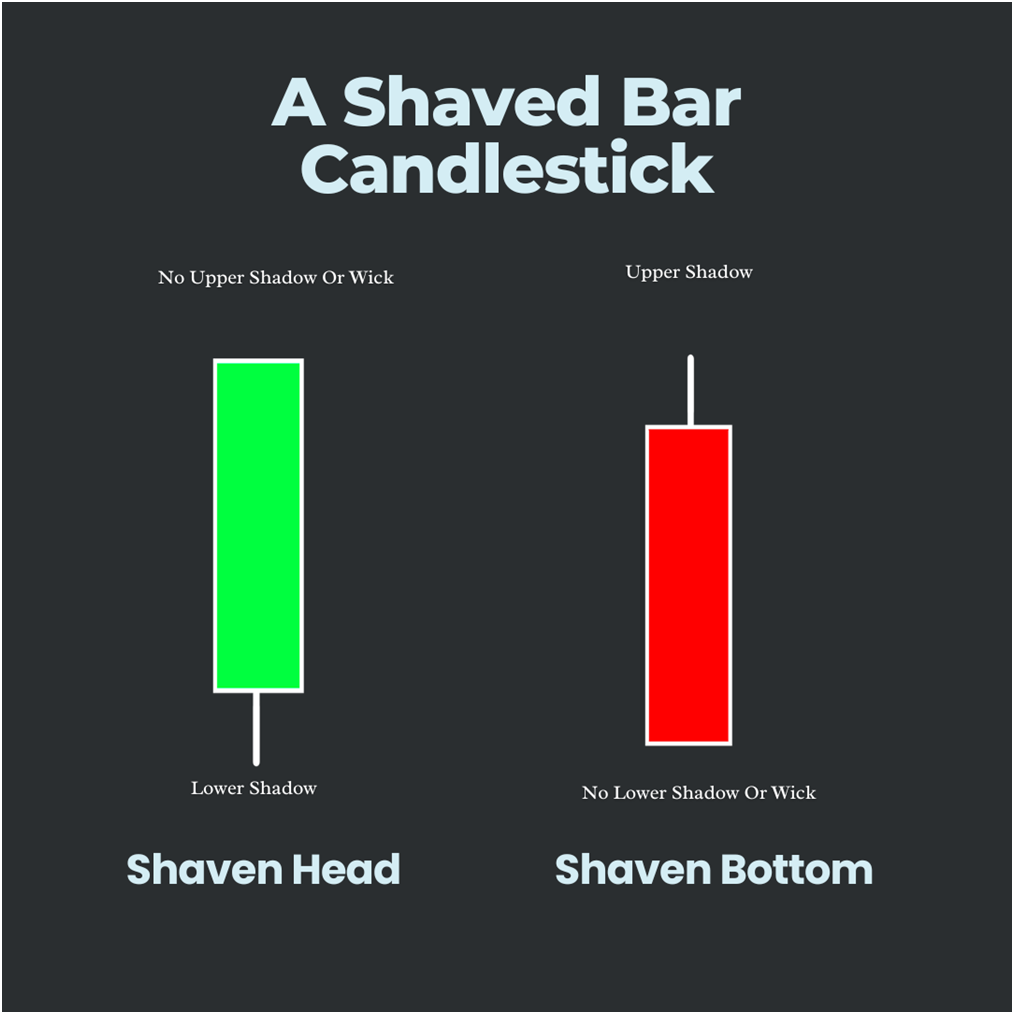
A shaved bar is a candlestick pattern where the open and/or close of the candlestick is at or near the high or low of the period. It indicates strong buying or selling pressure in the market. The CM_Price-Action-Bars indicator allows users to customize the percentage of the candlestick range required for a shaved bar. For example, if the user sets the percentage to 5%, the shaved bar must close within 5% of the high or low of the candlestick.

To identify a bullish shaved bar, the script looks for candles where the close is near the high of the period. For a bearish shaved bar, it looks for candles where the close is near the low of the period.
Inside and Outside Bars:
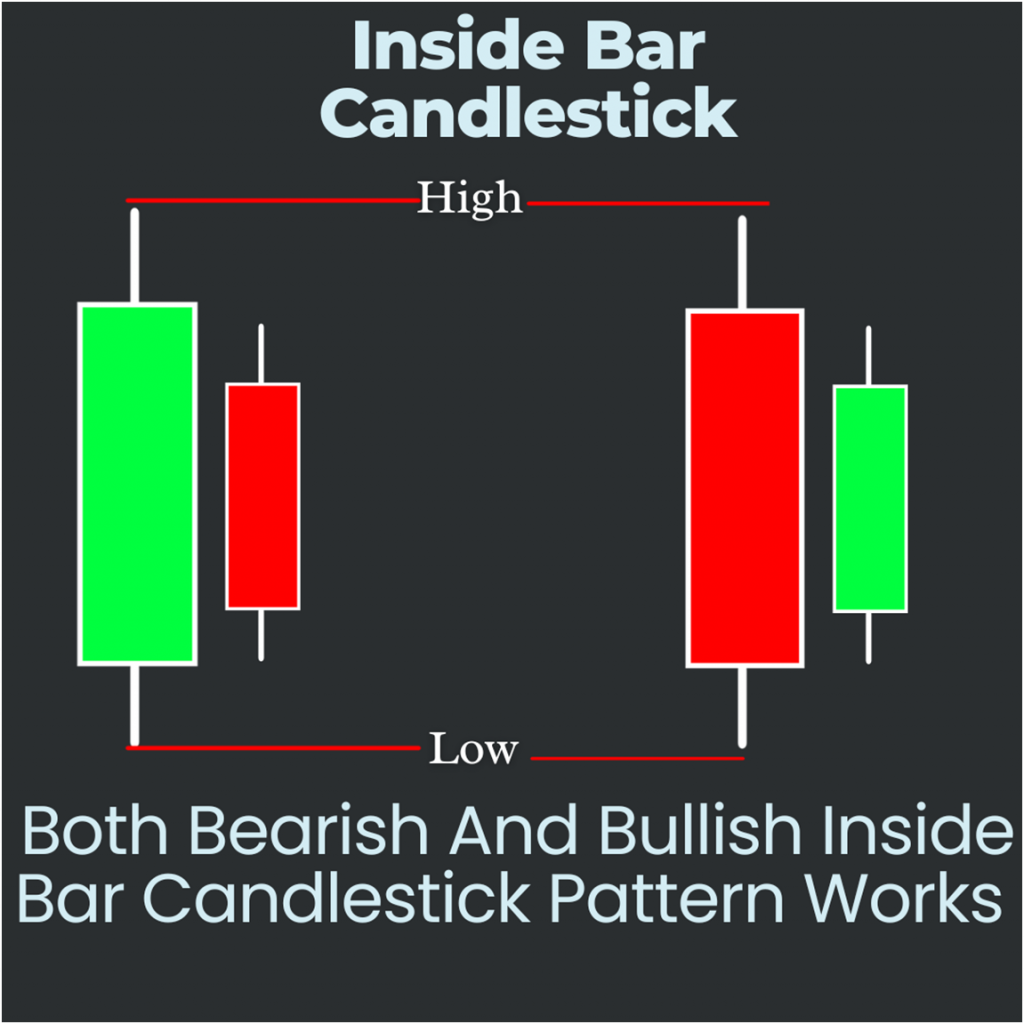
An inside bar is a candlestick pattern where the high and low of the candlestick are within the range of the previous candlestick. It indicates a potential consolidation in the market. An outside bar, on the other hand, is a candlestick pattern where the high and low of the candlestick exceed the range of the previous candlestick. It indicates a potential breakout or reversal in the market.

To identify an inside bar, the script looks for candles where the high is lower than or equal to the previous candle’s high and the low is higher than or equal to the previous candle’s low. For an outside bar, it looks for candles where the high is higher than the previous candle’s high and the low is lower than the previous candle’s low.
Gray Bars:
The CM_Price-Action-Bars indicator also includes an option to turn the bars gray. This can be useful for traders who want to distinguish between the custom indicator bars and the regular price bars on the chart.
Here I am going to explain you the pinescript code details:
‘study(“CM_Price-Action-Bars”, overlay=true)’
The first line defines the script name and sets the chart overlay property to true.
‘pctP = input(66, minval=1, maxval=99, title=”Percentage Input For PBars, What % The Wick Of Candle Has To Be”)’
This line creates an input variable called “pctP” which represents the percentage of the candle wick that must be present for a Pin Bar to be considered valid. The default value is set to 66, with a minimum value of 1 and maximum value of 99.
‘pblb = input(6, minval=1, maxval=100, title=”PBars Look Back Period To Define The Trend of Highs and Lows”)’
This line creates an input variable called “pblb” which represents the look-back period used to define the trend of highs and lows. The default value is set to 6, with a minimum value of 1 and maximum value of 100.
‘pctS = input(5, minval=1, maxval=99, title=”Percentage Input For Shaved Bars, Percent of Range it Has To Close On The Lows or Highs”)’
This line creates an input variable called “pctS” which represents the percentage of the range that a Shaved Bar must close on the lows or highs to be considered valid. The default value is set to 5, with a minimum value of 1 and maximum value of 99.
‘spb = input(false, title=”Show Pin Bars?”)’
This line creates an input variable called “spb” which determines whether or not to display Pin Bars on the chart. The default value is set to false, meaning that Pin Bars will not be displayed by default.
‘ssb = input(false, title=”Show Shaved Bars?”)’
This line creates an input variable called “ssb” which determines whether or not to display Shaved Bars on the chart. The default value is set to false, meaning that Shaved Bars will not be displayed by default.
‘sib = input(false, title=”Show Inside Bars?”)’
This line creates an input variable called “sib” which determines whether or not to display Inside Bars on the chart. The default value is set to false, meaning that Inside Bars will not be displayed by default.
‘sob = input(false, title=”Show Outside Bars?”)’
This line creates an input variable called “sob” which determines whether or not to display Outside Bars on the chart. The default value is set to false, meaning that Outside Bars will not be displayed by default.
‘sgb = input(false, title=”Check Box To Turn Bars Gray?”)’
This line creates an input variable called “sgb” which determines whether or not to display bars in gray on the chart. The default value is set to false, meaning that bars will not be displayed in gray by default.
‘pctCp = pctP * .01’
This line calculates the percentage value for Pin Bars.
‘pctCPO = 1 – pctCp’
This line calculates the inverse percentage value for Pin Bars.
‘pctCs = pctS * .01’
This line calculates the percentage value for Shaved Bars.
‘pctSPO = pctCs’
This line sets the percentage value for Shaved Bars.
‘range = high – low’
This line calculates the range of each candle on the chart.
//Shaved Bars
‘sBarUp() => ssb and (close >= (high – (range * pctCs)))’
‘sBarDown() => ssb and close <= (low + (range * pctCs))’
These lines define two functions, ‘sBarUp()’ and ‘sBarDown()’, which are used to determine whether a given candle is a “shaved bar” (also known as a “razor bar”). A shaved bar is a candle where the close is very close to either the high or the low, indicating strong buying or selling pressure. In this implementation, a candle is considered a shaved bar if it closes above a certain percentage (set by pctS) of the distance from its high to its low (range).
//Inside Bars
‘insideBar() => sib and high <= high[1] and low >= low[1] ? 1 : 0’
‘outsideBar() => sob and (high > high[1] and low < low[1]) ? 1 : 0’
These lines define two more functions, ‘insideBar()’ and ‘outsideBar()’, which are used to identify “inside bars” and “outside bars”. An inside bar is a candle where both the high and low are within the range of the previous candle, indicating a period of consolidation. An outside bar is a candle where the high is higher and the low is lower than the previous candle, indicating a potential trend reversal. These functions use the ‘sib’ and ‘sob’ inputs to determine whether or not to display these bars on the chart.
//PinBars
barcolor(pBarUp() ? lime : na)
barcolor(pBarDn() ? red : na)
//Shaved Bars
barcolor(sBarDown() ? fuchsia : na)
barcolor(sBarUp() ? aqua : na)
//Inside and Outside Bars
barcolor(insideBar() ? yellow : na )
barcolor(outsideBar() ? orange : na )
barcolor(sgb and close ? gray : na)
Finally, these lines use the functions defined earlier to color the bars on the chart based on their type. If ‘spb’ is set to true, pin bars will be colored green (for bullish pin bars) or red (for bearish pin bars). If ‘ssb’ is set to true, shaved bars will be colored aqua (for bullish shaved bars) or fuchsia (for bearish shaved bars). If ‘sib’ is set to true, inside bars will be colored yellow, and if ‘sob’ is set to true, outside bars will be colored orange. If ‘sgb’ is set to true, all bars will be colored gray.
Overall, this script is a comprehensive tool for analyzing price action on a chart, and can be customized to display a variety of different candlestick patterns.
Conclusion:
The CM_Price-Action-Bars indicator is a customizable tool for identifying specific price action patterns on a price chart. By providing visual markers for pin bars, shaved bars, inside bars, and outside bars, the indicator helps traders quickly identify potential trading opportunities. The user-defined parameters for each pattern allow traders to customize the indicator to their specific trading strategies.

Hi, this is a comment.
To get started with moderating, editing, and deleting comments, please visit the Comments screen in the dashboard.
Commenter avatars come from Gravatar.